|
Cellular Technology Ltd
image acquisition v4 5 software Image Acquisition V4 5 Software, supplied by Cellular Technology Ltd, used in various techniques. Bioz Stars score: 99/100, based on 1 PubMed citations. ZERO BIAS - scores, article reviews, protocol conditions and more https://www.bioz.com/product/fluorescence+immunospot+imaging+analysis+system/ImmunoSpot+Software/10__1097_slash_qad__0000000000001576-60-18-22 Average 99 stars, based on 1 article reviews
image acquisition v4 5 software - by Bioz Stars,
2026-11
99/100 stars
|
Buy from Supplier |
|
AID Diagnostika
elispot plate reader Elispot Plate Reader, supplied by AID Diagnostika, used in various techniques. Bioz Stars score: 90/100, based on 1 PubMed citations. ZERO BIAS - scores, article reviews, protocol conditions and more https://www.bioz.com/product/fluorescence+immunospot+imaging+analysis+system/elispot+reader/10__1128_slash_aem__01953___12-76-6-12 Average 90 stars, based on 1 article reviews
elispot plate reader - by Bioz Stars,
2026-11
90/100 stars
|
Buy from Supplier |
|
Cellular Technology Ltd
s6 universal analyzer S6 Universal Analyzer, supplied by Cellular Technology Ltd, used in various techniques. Bioz Stars score: 99/100, based on 1 PubMed citations. ZERO BIAS - scores, article reviews, protocol conditions and more https://www.bioz.com/product/fluorescence+immunospot+imaging+analysis+system/S6+Universal+M2/pm39672954-339-10-8 Average 99 stars, based on 1 article reviews
s6 universal analyzer - by Bioz Stars,
2026-11
99/100 stars
|
Buy from Supplier |
|
Chondrex Inc
ova specific igg1 antibody  Ova Specific Igg1 Antibody, supplied by Chondrex Inc, used in various techniques. Bioz Stars score: 93/100, based on 1 PubMed citations. ZERO BIAS - scores, article reviews, protocol conditions and more https://www.bioz.com/product/fluorescence+immunospot+imaging+analysis+system/Mouse+Anti+OVA+Monoclonal+IgG1+Antibody+L71%2C+lyophilized/bio_rxiv__2024__02__20__581262-244-29-34 Average 93 stars, based on 1 article reviews
ova specific igg1 antibody - by Bioz Stars,
2026-11
93/100 stars
|
Buy from Supplier |
|
Mabtech Inc
mabtech iris fluorospot elispot reader Mabtech Iris Fluorospot Elispot Reader, supplied by Mabtech Inc, used in various techniques. Bioz Stars score: 86/100, based on 1 PubMed citations. ZERO BIAS - scores, article reviews, protocol conditions and more https://www.bioz.com/product/fluorescence+immunospot+imaging+analysis+system/elispot+fluorospot+iris+mabtech+reader/med_rxiv__64898__2026__01__17__26344231-137-11-11 Average 86 stars, based on 1 article reviews
mabtech iris fluorospot elispot reader - by Bioz Stars,
2026-11
86/100 stars
|
Buy from Supplier |
|
SouthernBiotech
hrp conjugated goat anti mouse igg1 antibody  Hrp Conjugated Goat Anti Mouse Igg1 Antibody, supplied by SouthernBiotech, used in various techniques. Bioz Stars score: 96/100, based on 1 PubMed citations. ZERO BIAS - scores, article reviews, protocol conditions and more https://www.bioz.com/product/fluorescence+immunospot+imaging+analysis+system/Goat+Anti-Mouse+IgG+Fc-HRP/pmc03477010-145-6-11 Average 96 stars, based on 1 article reviews
hrp conjugated goat anti mouse igg1 antibody - by Bioz Stars,
2026-11
96/100 stars
|
Buy from Supplier |
|
Vector Laboratories
immpress hrp anti rat igg  Immpress Hrp Anti Rat Igg, supplied by Vector Laboratories, used in various techniques. Bioz Stars score: 94/100, based on 1 PubMed citations. ZERO BIAS - scores, article reviews, protocol conditions and more https://www.bioz.com/product/fluorescence+immunospot+imaging+analysis+system/HRP+Goat+Anti-Rat+IgG+Antibody+(Peroxidase)/pmc07326292-443-25-29 Average 94 stars, based on 1 article reviews
immpress hrp anti rat igg - by Bioz Stars,
2026-11
94/100 stars
|
Buy from Supplier |
|
Bio X Cell
invivomab anti human pd 1 j110  Invivomab Anti Human Pd 1 J110, supplied by Bio X Cell, used in various techniques. Bioz Stars score: 95/100, based on 1 PubMed citations. ZERO BIAS - scores, article reviews, protocol conditions and more https://www.bioz.com/product/fluorescence+immunospot+imaging+analysis+system/InVivoMAb+anti-human+PD-1/pmc09040166-4-0-5 Average 95 stars, based on 1 article reviews
invivomab anti human pd 1 j110 - by Bioz Stars,
2026-11
95/100 stars
|
Buy from Supplier |
|
Cell Signaling Technology Inc
pd l1 e1l3n xp rabbit anti human mab  Pd L1 E1l3n Xp Rabbit Anti Human Mab, supplied by Cell Signaling Technology Inc, used in various techniques. Bioz Stars score: 98/100, based on 1 PubMed citations. ZERO BIAS - scores, article reviews, protocol conditions and more https://www.bioz.com/product/fluorescence+immunospot+imaging+analysis+system/PD-L1+XP+Rabbit+mAb/pmc05788338-118-41-49 Average 98 stars, based on 1 article reviews
pd l1 e1l3n xp rabbit anti human mab - by Bioz Stars,
2026-11
98/100 stars
|
Buy from Supplier |
|
SouthernBiotech
tertiary goat anti mouse igg pe antibody Tertiary Goat Anti Mouse Igg Pe Antibody, supplied by SouthernBiotech, used in various techniques. Bioz Stars score: 94/100, based on 1 PubMed citations. ZERO BIAS - scores, article reviews, protocol conditions and more https://www.bioz.com/product/fluorescence+immunospot+imaging+analysis+system/Goat+Anti-Mouse+IgG%2C+Human+ads-BIOT/pm33276369-335-150-155 Average 94 stars, based on 1 article reviews
tertiary goat anti mouse igg pe antibody - by Bioz Stars,
2026-11
94/100 stars
|
Buy from Supplier |
|
R&D Systems
285-if  285 If, supplied by R&D Systems, used in various techniques. Bioz Stars score: 97/100, based on 1 PubMed citations. ZERO BIAS - scores, article reviews, protocol conditions and more https://www.bioz.com/product/fluorescence+immunospot+imaging+analysis+system/Recombinant+Human+IFN-gamma+Protein/pmc11471229-68-0-4 Average 97 stars, based on 1 article reviews
285-if - by Bioz Stars,
2026-11
97/100 stars
|
Buy from Supplier |
|
AvesLabs
chicken anti gfp antibodies  Chicken Anti Gfp Antibodies, supplied by AvesLabs, used in various techniques. Bioz Stars score: 98/100, based on 1 PubMed citations. ZERO BIAS - scores, article reviews, protocol conditions and more https://www.bioz.com/product/fluorescence+immunospot+imaging+analysis+system/Anti-Green+Fluorescent+Protein+(GFP)+Antibody/pmc11003454-65-31-34 Average 98 stars, based on 1 article reviews
chicken anti gfp antibodies - by Bioz Stars,
2026-11
98/100 stars
|
Buy from Supplier |
Image Search Results
Journal: bioRxiv
Article Title: Lung-resident memory B cells maintain allergic IgE responses in the respiratory tract
doi: 10.1101/2024.02.20.581262
Figure Lengend Snippet: (A) Schematic of local allergen sensitization. Mice were treated intranasally with ragweed pollen and ovalbumin (RWP+OVA) for five days in the first week, followed by two weeks of OVA alone, and vehicle control mice received intranasal PBS. Mice were analyzed on day 21. (B) Eosinophils (live CD45 + CD11c - CD11b + SiglecF + ) in bronchoalveolar lavage fluid (BALF) of PBS control (left) and allergen-sensitized (RWP+OVA) mice. Numbers are frequency, representative of 3 independent experiments with 3-8 mice per experiment. (C) Measurement of OVA-specific IgE and IgG1 in BALF by ELISA. (D) Intravascular labeling of lung B cells (live B220 + ) with anti-CD45 showing tissue-localized (unlabeled) and blood B cells (labeled). (E) Representative flow cytometry plots showing gating strategy for the identification of naïve (CD38 + IgD + , purple), memory (IgD - CD38 + GL7 - , green), and germinal center (GC, IgD - CD38 - GL7 + , orange) B cells (live B220 + i.v. CD45 - ) in the lungs of allergen-sensitized mice. (F) Frequencies and cell counts of naïve, memory, and GC B cells in the lungs. Representative data from four independent experiments with 3-8 mice per group in each experiment (mean ± SD).
Article Snippet: Standard curves were constructed by 2-fold dilutions of OVA-specific IgE monoclonal antibody (clone E-C1, Chondrex) diluted in 10% FBS in PBS from 200 ng/mL to 0.195 ng/mL, or with
Techniques: Control, Enzyme-linked Immunosorbent Assay, Labeling, Flow Cytometry
Journal: bioRxiv
Article Title: Lung-resident memory B cells maintain allergic IgE responses in the respiratory tract
doi: 10.1101/2024.02.20.581262
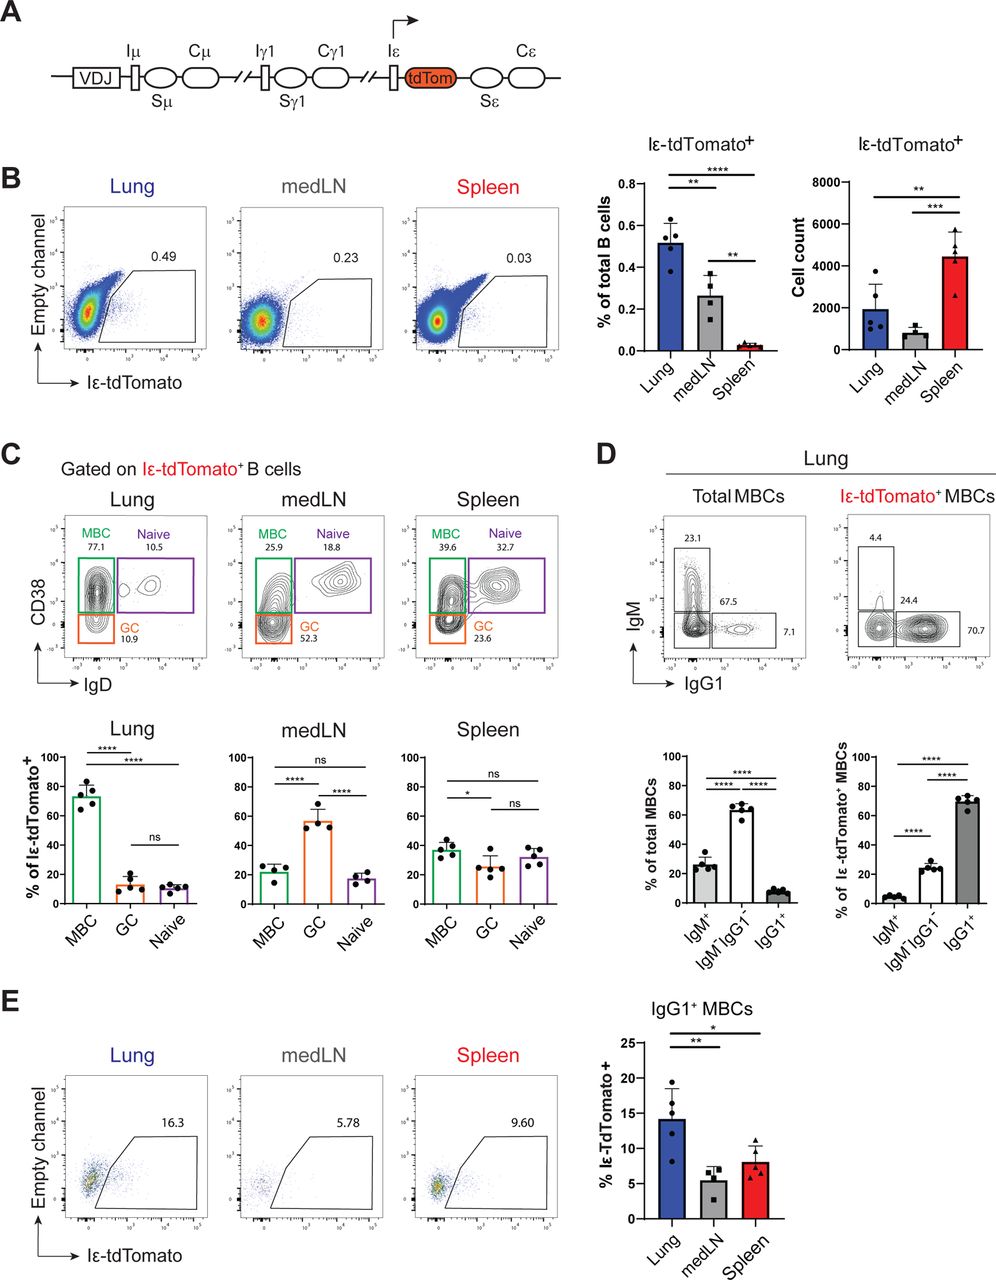
Figure Lengend Snippet: (A) Schematic of Iε-tdTomato knock-in mouse reporting germline transcription at Iε locus. (B) Representative plots by flow cytometry showing Iε-tdTomato expression by B cells (live B220 + i.v. CD45 - ) in the lungs, medLN, and spleen on day 21 (left) and frequencies and cell counts of Iε-tdTomato + B cells (right). (C) Representative plots by flow cytometry showing the identification of naïve, germinal center (GC), and memory B cells (MBCs, top) and frequencies of each subset (bottom) among total Iε-tdTomato + B cells. (D) Surface expression of IgM and IgG1 on total MBCs and Iε-tdTomato + MBCs in the lungs (top) and frequencies of each population (bottom). (E) Expression of Iε-tdTomato among IgG1 + MBCs in the lungs, medLN, and spleen. Data are representative of three independent experiments with 5-9 mice in each experiment. One-way ANOVA with Tukey’s multiple comparisons test on mean ± SD; *, p<0.05; **, p<0.01; ***, p<0.001; ****, p<0.0001).
Article Snippet: Standard curves were constructed by 2-fold dilutions of OVA-specific IgE monoclonal antibody (clone E-C1, Chondrex) diluted in 10% FBS in PBS from 200 ng/mL to 0.195 ng/mL, or with
Techniques: Knock-In, Flow Cytometry, Expressing

Journal: bioRxiv
Article Title: Lung-resident memory B cells maintain allergic IgE responses in the respiratory tract
doi: 10.1101/2024.02.20.581262
Figure Lengend Snippet: (A) Immunofluorescence imaging showing localization of B cells (CD19 + ) and CD4 + T cells on day 77. Whole lung section (10x, left) and 63x magnification of indicated areas (right). (B) Number of IgM + (top) and IgG1 + (bottom) MBCs in the lungs at indicated timepoints. Mean ± SEM, representative of two independent experiments. (C) Experimental scheme for parabiosis experiments. CD45 congenic mice were surgically paired 4 weeks after allergen sensitization and tissues were analyzed for MBC chimerism 10 days later. (D) Representative flow cytometry plots and (E) aggregate frequencies of chimerism of MBCs in indicated tissues based on expression of CD45.1 and CD45.2. Mean ± SD, n=6.
Article Snippet: Standard curves were constructed by 2-fold dilutions of OVA-specific IgE monoclonal antibody (clone E-C1, Chondrex) diluted in 10% FBS in PBS from 200 ng/mL to 0.195 ng/mL, or with
Techniques: Immunofluorescence, Imaging, Flow Cytometry, Expressing

Journal: bioRxiv
Article Title: Lung-resident memory B cells maintain allergic IgE responses in the respiratory tract
doi: 10.1101/2024.02.20.581262
Figure Lengend Snippet: (A) Violin plots showing scaled expression of indicated genes from day 77 scRNA-seq libraries. (B) Histograms showing surface staining of indicated markers on MBCs from each tissue on day 77 by flow cytometry. Each histogram is concatenated from 8 mice. Dashed lines indicate staining from negative control. (C) Expression and gating of IgM and IgG1 on MBCs in the lungs (i.v. CD45 - ) on day 77. (D) Histograms showing surface expression of markers from day 77 libraries and (E) surface markers from A and B on IgM + and IgG1 + MBCs. Each histogram is concatenated from 8 mice. Control is only stained with CD19 and live/dead dye zombie NIR. (E) Expression of PD-L2 and CD80 and (G) CD73 and OVA-binding on IgM + and IgG1 + MBCs by flow cytometry on day 77. Representative staining from two independent experiments with 8 mice.
Article Snippet: Standard curves were constructed by 2-fold dilutions of OVA-specific IgE monoclonal antibody (clone E-C1, Chondrex) diluted in 10% FBS in PBS from 200 ng/mL to 0.195 ng/mL, or with
Techniques: Expressing, Staining, Flow Cytometry, Negative Control, Control, Binding Assay
Journal: bioRxiv
Article Title: Lung-resident memory B cells maintain allergic IgE responses in the respiratory tract
doi: 10.1101/2024.02.20.581262
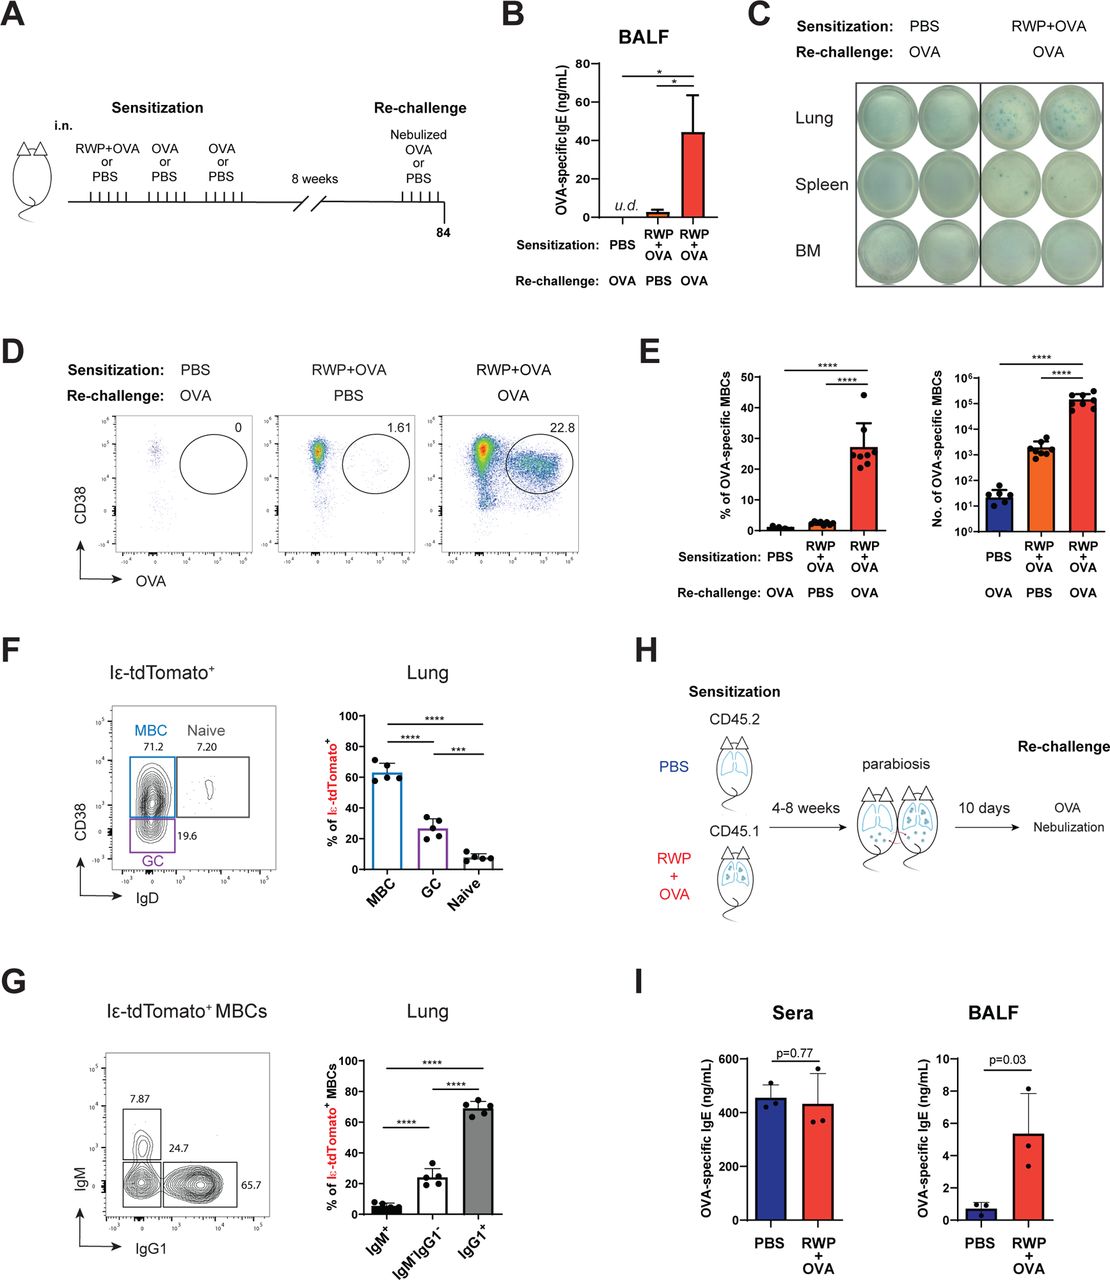
Figure Lengend Snippet: (A) Experimental schematic of rechallenge. Eight weeks after sensitization with RWP+OVA (or PBS control) mice were rechallenged with five consecutive days of nebulized OVA (in 1% PBS) or PBS (20 min/day) and analyzed on day 84. (B) Detection of OVA-specific IgE in bronchoalveolar lavage fluid (BALF) by ELISA. One-way ANOVA with Tukey’s multiple comparisons test (n=8). (C) Detection of OVA-specific IgE-secreting cells in single cell suspension from lungs, spleen or bone marrow (BM) by ELISpot with 1×10 6 cells plated per well. (D) Representative flow cytometry plots showing the identification of OVA-binding MBCs (i.v. CD45 - CD19 + IgD - ) in the lungs in each indicated condition. (E) Frequencies and numbers of OVA-specific MBCs in the lungs in each indicated condition. One-way ANOVA with Tukey’s multiple comparison’s test. (F) Representative (left) and summary plot (right) showing frequency of MBCs, naïve, and germinal center (GC) B cells among Iε-tdTomato + B cells in the lungs. Representative of three independent experiments, one-way ANOVA with Tukey’s multiple comparison’s test. (G) Expression of IgM and IgG1 among Iε-tdTomato + MBCs in the lungs. Representative plot (left) and aggregate frequencies by flow cytometry analyses (right). Representative of three independent experiments, one-way ANOVA with Tukey’s multiple comparison’s test. (H) Schematic of parabiosis experiments. RWP+OVA-sensitized mice were surgically paired to PBS control mice 4 or 8 weeks after sensitization. Ten days after surgery, pairs were rechallenged with five days of nebulized OVA (1% in PBS, 20 min/day). (I) Detection of OVA-specific IgE in sera and BALF of PBS or RWP+OVA-sensitized parabionts by ELISA after rechallenge with OVA. Representative data of two independent experiments. Bars are mean ± SD; *, p<0.05; ***, p<0.001; ****, p<0.0001.
Article Snippet: Standard curves were constructed by 2-fold dilutions of OVA-specific IgE monoclonal antibody (clone E-C1, Chondrex) diluted in 10% FBS in PBS from 200 ng/mL to 0.195 ng/mL, or with
Techniques: Control, Enzyme-linked Immunosorbent Assay, Suspension, Enzyme-linked Immunospot, Flow Cytometry, Binding Assay, Expressing
Journal: BMC Immunology
Article Title: B7h-expressing dendritic cells and plasma B cells mediate distinct outcomes of ICOS costimulation in T cell-dependent antibody responses
doi: 10.1186/1471-2172-13-29
Figure Lengend Snippet: ICOS costimulation mediated by plasma B cells and DCs selectively regulate the magnitude and isotype usage of antibody responses. Transgenic mice on the B7h +/+ background and non-transgenic littermate controls were immunized with NP-CGG in alum, and serum antibody responses were analyzed by ELISA. Relative isotype-specific anti-NP serum antibody concentrations at day 7 are shown for B-B7hTg ( A ) and DC-B7hTg ( B ) mice, compared with wild-type controls. ( C ) The relative serum concentrations of anti-NP IgG, IgG1, IgG2a, and the IgG2a/IgG1 ratio are shown at day 14 for transgenic and wild-type mice. Each symbol represents an individual immunized mouse and the mean of each group is indicated by a solid bar. The data were normalized such that control groups have mean value of 1. Asterisks and p values are shown where statistical significance (Student’s t test, p < 0.05) was detected between transgenic and control groups. The data are representative of at least 3 independent experiments.
Article Snippet: NP-specific spots were detected with an
Techniques: Clinical Proteomics, Transgenic Assay, Enzyme-linked Immunosorbent Assay, Control

Journal: BMC Immunology
Article Title: B7h-expressing dendritic cells and plasma B cells mediate distinct outcomes of ICOS costimulation in T cell-dependent antibody responses
doi: 10.1186/1471-2172-13-29
Figure Lengend Snippet: The level of B7h on plasma B cells regulates the number of antibody secreting cells generated by immunization. Transgenic and control mice on the B7h +/+ background were immunized with NP-CGG and analyzed after 14 days. ( A ) The relative concentration of anti-NP IgG1 antibodies in supernatants from overnight splenocyte cultures and in serum were measured by ELISA. Each symbol represents one mouse and bars indicate the mean of each group. The data were normalized such that the mean of the control group had a value of 1. P values are shown where statistically significant differences were found between transgenic and control groups. ( B ) The number of anti-NP IgG1-secreting splenocytes was determined using an ELISPOT assay. Symbols represent the population mean at each dilution and error bars show the standard error of the mean for each group. Statistical significance was found between control mice (n = 6) and B-B7hTg mice (n = 5), but not DC-B7hTg mice (n = 6). ( C ) The number of B220 + IgD neg- GL7 + Fas + germinal center B cells was determined by flow cytometry. Each symbol represents one mouse and bars indicate the mean of each group. The data are representative of at least 3 independent experiments.
Article Snippet: NP-specific spots were detected with an
Techniques: Clinical Proteomics, Generated, Transgenic Assay, Control, Concentration Assay, Enzyme-linked Immunosorbent Assay, Enzyme-linked Immunospot, Flow Cytometry

Journal: BMC Immunology
Article Title: B7h-expressing dendritic cells and plasma B cells mediate distinct outcomes of ICOS costimulation in T cell-dependent antibody responses
doi: 10.1186/1471-2172-13-29
Figure Lengend Snippet: The level of B7h on plasma B cells, but not on dendritic cells, regulates high-affinity antibody responses to T cell-dependent antigens. Transgenic B-B7hTg and DC-B7hTg mice on the B7h +/+ background, and non-transgenic B7h +/+ and B7h −/− controls were immunized with NP-CGG in alum, and the affinity of serum anti-NP IgG responses were assessed by ELISA after 21 days. Total NP-specific IgG (captured with NP 15 BSA; upper panels), high-affinity anti-NP IgG (captured with NP 1 BSA; middle), and the ratio of high affinity/total NP-specific IgG (lower panels) are shown relative to wild-type responses. Each symbol represents an individual mouse and bars indicate the mean of each group. The data were normalized such that the mean of the wild-type group was equal to 1. P values are shown for comparisons where differences were statistically significant. The data are representative of three independent experiments.
Article Snippet: NP-specific spots were detected with an
Techniques: Clinical Proteomics, Transgenic Assay, Enzyme-linked Immunosorbent Assay

Journal: BMC Immunology
Article Title: B7h-expressing dendritic cells and plasma B cells mediate distinct outcomes of ICOS costimulation in T cell-dependent antibody responses
doi: 10.1186/1471-2172-13-29
Figure Lengend Snippet: B7h expression on DCs, but not plasma B cells, contributes to germinal center formation and enhances IgG2a isotype usage. Transgenic mice on the B7h −/− background were immunized with NP-CGG in alum, and analyzed after 14–21 days. ( A ) Splenic cryosections were analyzed by immunohistochemistry on day 14 to reveal PNA+ germinal centers (indicated by arrow). Images are representative of larger fields shown in Additional file : Figure S2. Original total magnification was 64X. ( B ) The number of germinal center B cells measured by flow cytometry, the relative cross-sectional area of germinal centers determined by imaging, and serum anti-NP IgG responses measured by ELISA at day 14 are shown. The relative affinities of serum anti-NP antibody responses were measured by the ratio of NP 1 /NP 15 -binding serum IgG on day 21. ( C ) The ratios of NP-specific IgG2a and IgG1 to total NP-specific IgG in serum on day 14, determined by ELISA, are shown. For ELISA and flow cytometry data, each symbol represents an individual immunized mouse. For GC size analysis, each symbol represents an individual germinal center. The mean of each group is indicated by a solid bar, and p values are shown where significance was detected (Student’s t test, p < 0.05) between the B7h −/− group and transgenic or B7h +/+ groups. For ELISA data, the mean values from control B7h −/− groups were set to a value of 1. The data are representative of three independent experiments.
Article Snippet: NP-specific spots were detected with an
Techniques: Expressing, Clinical Proteomics, Transgenic Assay, Immunohistochemistry, Flow Cytometry, Imaging, Enzyme-linked Immunosorbent Assay, Binding Assay, Control
Journal: Cell Reports
Article Title: Fibroblast-Derived STC-1 Modulates Tumor-Associated Macrophages and Lung Adenocarcinoma Development
doi: 10.1016/j.celrep.2020.107802
Figure Lengend Snippet:
Article Snippet: Plates were then incubated with anti-GRP94 rat monoclonal antibody (9G10, Enzo Life Sciences, 2 μg/ml in 1x ELISA/ELISPOT diluent) for 1h, followed by incubation with
Techniques: Plasmid Preparation, Recombinant, Enzyme-linked Immunosorbent Assay, Multiplex Assay, Software, Imaging, Mass Spectrometry
Journal: Cell Reports Medicine
Article Title: AXL targeting restores PD-1 blockade sensitivity of STK11/LKB1 mutant NSCLC through expansion of TCF1 + CD8 T cells
doi: 10.1016/j.xcrm.2022.100554
Figure Lengend Snippet:
Article Snippet:
Techniques: Control, Flow Cytometry, Recombinant, Liposomes, Blocking Assay, Plasmid Preparation, Modification, Proliferation Assay, Multiplex Assay, Enzyme-linked Immunospot, Enzyme-linked Immunosorbent Assay, Cell Isolation, Selection, Isolation, Western Blot, Polymer, Sequencing, Software, Imaging
Journal: PLoS Medicine
Article Title: PD-L1 checkpoint inhibition and anti-CTLA-4 whole tumor cell vaccination counter adaptive immune resistance: A mouse neuroblastoma model that mimics human disease
doi: 10.1371/journal.pmed.1002497
Figure Lengend Snippet: (A) PD-L1 expression on the surface of mouse Neuro2a was analyzed by flow cytometry and is up-regulated in a dose-dependent manner (mean fluorescent intensity [MFI]). The expression of PD-L1 on human neuroblastoma cell lines SY5Y and SK-N-SH (non-NMYC amplified) had similar changes with exposure to IFNγ. (B) CD3 and PD-L1 expression in mouse neuroblastoma tumors following receipt of Id2kd vaccine with or without checkpoint blockade therapy. Representative tumors were dissected from naïve mice (I, V, IX, and XIII) and from mice after receipt of Id2kd vaccine (II, VI, X, and XIV), Id2kd plus PD-L1 antibody (III, VII, XI, and XV), and Id2kd plus CTLA-4 antibody (IV, VIII, XII, and XVI). Hematoxylin and eosin (H&E) staining (I–VIII) and immunofluorescence double staining (IX–XVI) for CD3 (green) and PD-L1 (red) were performed. The nuclei were stained with DAPI (blue). Representative micrographs from each cohort are shown. Areas of necrotic tissues are marked with black broken lines and coincide with areas of inflammatory cell infiltrates. Panel 1 (I–IV) and panel 3 (IX–XII) are 40× and 100× original magnification, respectively. The scale bar for (I–IV) is 500 μm and for (IX–XII) is 100 μm. The enlarged images in panel 2 (V–VIII) and panel 4 (XIII–XVI) are of 600× original magnification. The scale bar is 20 μm. (C) Expression of activation markers on the surface of CD8+ tumor-infiltrating lymphocytes isolated from shrinking tumors of mice treated with α-CTLA-4 plus Id2kd vaccine. Programmed cell death 1 (PD1), TIM3, and LAG3 were expressed on tumor-infiltrating lymphocytes (TILs) by flow cytometry compared with isotype controls. APC, antigen-presenting cell; FITC, fluorescein isothiocyanate; IgG, immunoglobulin G; PerCP, peridinin-chlorophyll-protein complex.
Article Snippet: For double staining with PD-L1, the slides were brought to a boil, the antibody-antigen reaction for CD3 was stripped in 10 mM sodium citrate buffer (PH = 6, #14746, cell signaling) for 10 minutes, and then repeat staining/boosting/detection was performed using
Techniques: Expressing, Flow Cytometry, Amplification, Staining, Immunofluorescence, Double Staining, Activation Assay, Isolation

Journal: PLoS Medicine
Article Title: PD-L1 checkpoint inhibition and anti-CTLA-4 whole tumor cell vaccination counter adaptive immune resistance: A mouse neuroblastoma model that mimics human disease
doi: 10.1371/journal.pmed.1002497
Figure Lengend Snippet: A/J mice were inoculated with 1 × 10 6 wild-type (WT) N2a, and once tumors were established, the mice were then vaccinated with various combinations of Id2kd-N2a, α-CTLA-4, and α-PD-L1 blocking antibodies. (A) This panel depicts the vaccination protocol and timeline. (B) Tumor eradication in vaccinated mice ( n = 6) as detected by chemiluminescent imaging. (C) Tumor growth in various treatment groups following vaccination. Ten out of 10 mice were cured of tumors when Id2kd-N2a vaccine was combined with inhibition of CTLA-4 and programmed cell death-ligand 1 (PD-L1) checkpoints. The graphs depict individual tumor growth over time and cure in parenthesis. (D) Average tumor growth (left panel) and survival (right) are markedly improved in the group receiving a combination of Id2kd N2a, α-CTLA-4, and α-PD-L1 when compared with other treatments ( p = 0.0007 for average tumor growth in untreated versus α-PD-L1+α-CTLA-4+Id2kd N2a, p = 0.0005 for WT N2a +α-PD-L1 versus full combination, p = 0.0025 for WT N2a +α-PD-L1+Id2kd N2a versus full combination, 2-way repeated measures ANOVA analysis, left panel; right panel p = 0.0006 for survival trend, log-rank test; p = 0.0007 in untreated control versus α-PD-L1+α-CTLA-4+Id2kd N2a, p = 0.007 in α-PD-L1 versus combination, p = 0.0008 in α-PD-L1+Id2kd N2a versus combination, p = 0.0034 in α-PD-L1+α-CTLA-4 versus combination treatment, log-rank test).
Article Snippet: For double staining with PD-L1, the slides were brought to a boil, the antibody-antigen reaction for CD3 was stripped in 10 mM sodium citrate buffer (PH = 6, #14746, cell signaling) for 10 minutes, and then repeat staining/boosting/detection was performed using
Techniques: Blocking Assay, Imaging, Inhibition, Control

Journal: PLoS Medicine
Article Title: PD-L1 checkpoint inhibition and anti-CTLA-4 whole tumor cell vaccination counter adaptive immune resistance: A mouse neuroblastoma model that mimics human disease
doi: 10.1371/journal.pmed.1002497
Figure Lengend Snippet: CD8+ TILs isolated from tumors of mice treated with α-CTLA-4+vaccine were cocultured with wild-type (WT) N2a cells at a 10:1 ratio, for 40 hours in an IFNγ Enzyme-Linked ImmunoSpot (ELISpot) assay. Where indicated, N2a cells were blocked with 10 μg/ml α-PD-L1 for 24 hours prior to coculture, and blocking was maintained during the assay. Also as indicated, α-PD1 and α-TIM3 were added to the reactions at 10 μg/ml for the duration of the assay. Panel A shows actual IFNγ spots/well imaged from ELISpot assay in duplicate. Panel B graphs enumerated spots captured from an ELISpot reader in which each spot corresponds to a T cell producing IFNγ (unpaired 2-tailed Student t test, p < 0.0485 where significant, p > 0.0595 where not significant).
Article Snippet: For double staining with PD-L1, the slides were brought to a boil, the antibody-antigen reaction for CD3 was stripped in 10 mM sodium citrate buffer (PH = 6, #14746, cell signaling) for 10 minutes, and then repeat staining/boosting/detection was performed using
Techniques: Isolation, Enzyme-linked Immunospot, Blocking Assay

Journal: PLoS Medicine
Article Title: PD-L1 checkpoint inhibition and anti-CTLA-4 whole tumor cell vaccination counter adaptive immune resistance: A mouse neuroblastoma model that mimics human disease
doi: 10.1371/journal.pmed.1002497
Figure Lengend Snippet: (A) Modified T-cell cytotoxicity assay by caspase-3 cleavage assay. Interferon gamma (IFNγ) was used to up-regulate PD-L1 in wild-type (WT) cells. R1 represents the labeled tumor target cells, while R2 is the percentage of target cells positive for activated caspase-3. Drug cytotoxicity was induced by a combination of 1 μm staurosporine and 1 μm camptothecin, incubated for the same time as the other reactions. (B) Long-term memory response of survivors. Splenocytes were isolated from mice at 6 months following cure with α-PD-L1+α-CTLA-4 plus vaccine, as well as from naïve mice. N2a cells were cocultured with splenocytes at a 1:10 ratio for 48 hours. Supernatants were tested for IFNγ expression levels by ELISA. Naïve controls produced no detectable IFNγ (Student t test, p = 0.01; splenocyte IFNγ level with α-PD-L1 blockade).
Article Snippet: For double staining with PD-L1, the slides were brought to a boil, the antibody-antigen reaction for CD3 was stripped in 10 mM sodium citrate buffer (PH = 6, #14746, cell signaling) for 10 minutes, and then repeat staining/boosting/detection was performed using
Techniques: Modification, Cytotoxicity Assay, Cleavage Assay, Labeling, Incubation, Isolation, Expressing, Enzyme-linked Immunosorbent Assay, Produced

Journal: PLoS Medicine
Article Title: PD-L1 checkpoint inhibition and anti-CTLA-4 whole tumor cell vaccination counter adaptive immune resistance: A mouse neuroblastoma model that mimics human disease
doi: 10.1371/journal.pmed.1002497
Figure Lengend Snippet: Programmed cell death-ligand 1 (PD-L1) is expressed at 3.7-fold-lower levels on aggressive mouse neuroblastoma cell line AgN2a, as evidenced by flow cytometry (A) and real-time quantitative PCR (RT-qPCR) ( p < 0.005, Student t test) (B). (C) Exposure to even high levels of interferon gamma (IFNγ) does not up-regulate PD-L1 on AgN2a at 24 hours. (D) Similarly, the human NMYC-amplified IMR-32 cell line failed to up-regulate PD-L1 expression, unlike the other non-NMYC-amplified cell lines tested. . (E) Both CD3 (green) and PD-L1 (red) expression were examined by immunofluorescence (IF) staining and confocal microscopy in WT 2a and AgN2a mouse tumors at baseline and following vaccination. Representative tumors were obtained from naïve mice and mice following receipt of Id2kd vaccine plus CTLA-4 antibody alone. The nuclei were stained with DAPI (blue). Tissue sections were imaged at 200× original magnification, and the scale bar is 50 μm. IF staining demonstrates the minimal PD-L1 expression AgN2a tumors compared to WT N2a tumors, which may explain the sensitivity of AgN2a to vaccine and anti-CTLA-4 alone, without anti-PD-L1 therapy.
Article Snippet: For double staining with PD-L1, the slides were brought to a boil, the antibody-antigen reaction for CD3 was stripped in 10 mM sodium citrate buffer (PH = 6, #14746, cell signaling) for 10 minutes, and then repeat staining/boosting/detection was performed using
Techniques: Flow Cytometry, Real-time Polymerase Chain Reaction, Quantitative RT-PCR, Amplification, Expressing, Immunofluorescence, Staining, Confocal Microscopy

Journal: PLoS Medicine
Article Title: PD-L1 checkpoint inhibition and anti-CTLA-4 whole tumor cell vaccination counter adaptive immune resistance: A mouse neuroblastoma model that mimics human disease
doi: 10.1371/journal.pmed.1002497
Figure Lengend Snippet: (A) Immunofluorescence (IF) double staining of PD-L1 (green) and CD3 (red) was performed on the paraffin-embedded neuroblastoma tumor tissue biopsied from high-risk (A I–III), intermediate-risk (A IV–VI), and low-risk (A VII–IX) tumors. The nuclei were stained with DAPI (blue), and the IF staining of CD3 was confirmed by immunohistochemical staining (X–XII). Tissue sections were imaged at 100× original magnification. The scale bar is 100 μm for (I–IX) and 50 μm for (X–XII). (B) The density of PD-L1 and CD3 staining as determined by digital image analysis shows significantly higher signal in low- and intermediate-risk groups compared to high-risk tumors. Each dot represents the mean fluorescent pixel area for a single subject. ( P -values were calculated with an unpaired Student t test.).
Article Snippet: For double staining with PD-L1, the slides were brought to a boil, the antibody-antigen reaction for CD3 was stripped in 10 mM sodium citrate buffer (PH = 6, #14746, cell signaling) for 10 minutes, and then repeat staining/boosting/detection was performed using
Techniques: Immunofluorescence, Double Staining, Staining, Immunohistochemical staining

Journal: PLoS Medicine
Article Title: PD-L1 checkpoint inhibition and anti-CTLA-4 whole tumor cell vaccination counter adaptive immune resistance: A mouse neuroblastoma model that mimics human disease
doi: 10.1371/journal.pmed.1002497
Figure Lengend Snippet: During the priming phase, CTLA-4 blockade enhances the activation and proliferation of T cells that express programmed cell death 1 (PD1) and migrate to the tumor. Programmed cell death-ligand 1 (PD-L1) is up-regulated on the tumor cells, inducing adaptive resistance. Blockade of PD-L1 allows for enhanced cytotoxic effector function of the CD8 + tumor-infiltrating lymphocytes. In the nonimmunogenic model (AgN2a), adaptive resistance through PD-L1 is of less importance. APC, antigen-presenting cell; MHC, major histocompatibility complex; TCR, T-cell receptor. (Artwork generated by Olivia Abbate).
Article Snippet: For double staining with PD-L1, the slides were brought to a boil, the antibody-antigen reaction for CD3 was stripped in 10 mM sodium citrate buffer (PH = 6, #14746, cell signaling) for 10 minutes, and then repeat staining/boosting/detection was performed using
Techniques: Activation Assay, Immunopeptidomics, Generated
Journal: iScience
Article Title: Exploring immune response toward transplanted human kidney tissues assembled from organoid building blocks
doi: 10.1016/j.isci.2024.110957
Figure Lengend Snippet:
Article Snippet:
Techniques: Blocking Assay, Recombinant, Binding Assay, Staining, Clinical Proteomics, Plasmid Preparation, In Situ, Enzyme-linked Immunospot, Gene Expression, Software, Imaging, Microscopy
Journal: Cancer Research Communications
Article Title: Overcoming Xenoantigen Immunity to Enable Cellular Tracking and Gene Regulation with Immune-competent “NoGlow” Mice
doi: 10.1158/2767-9764.CRC-24-0062
Figure Lengend Snippet: Tolerance to foreign antigens is animal model specific. A and B, Mice expressing GFP and Luc in the pituitary (GH; n = 5), full-body GFP, and Luc (CAG Luc-GFP; n = 5), in FoxP3 + cells (Foxp3-GFP; n = 4), or wild-type (WT) C57Bl/6 ( n = 4) were vaccinated with adenovirus (Ad) encoding GFP/Luc (2.6 × 10 10 vp/mouse) and anti-Luciferase (A) or anti-GFP (B) in the serum were evaluated by ELISA after 2 weeks. Only CAG Luc-GFP animals, which express both GFP and Luc, display humoral tolerance to both upon vaccination. P values shown are at 1:50 dilution by two-way ANOVA with Tukey multiple comparisons test. C and D, E0771 GFP-Luc cells were implanted into the MFP of female WT C57Bl/6, GH, or CAG Luc-GFP mice ( n = 10 each) and subsequently vaccinated with Ad-GFP/Luc or Ad-LacZ as control on day 3 ( n = 5/group each). Growth of individual tumors for the duration of the experiment (C) or average tumor volume until time of first euthanasia (D) comparing control or antigen-specific Ad demonstrate that E0771 GFP-Luc cells grow significantly larger in tolerant CAG Luc-GFP mice. P values shown are at day of first euthanasia by two-way ANOVA with Bonferroni multiple comparisons test. E, Female WT ( n = 3) or mice expressing human HER2 under the whey acid protein (WAP) promoter (WAP HER2; n = 5) or MMTV Cre–driven CAG promoter (MMTV CAG HER2; n = 3) were vaccinated with Ad-Human Her2 and splenocytes were analyzed for anti-HER2 responses by ELISPOT after 3 weeks. WAP HER2 mice displayed reduced anti-HER2 responses compared with WT animals; however, MMTV CAG HER2 animals produced a limited anti-HER2 T-cell response compared with both WT and WAP HER2. Groups were compared by two-way ANOVA with Tukey multiple comparisons test. F, Doxycycline-inducible GFP animals were given doxycycline (dox)-containing chow at the indicated time points, vaccinated at 9 weeks old, and euthanized after two weeks. G, Serum anti-GFP responses in animals from F reveal that GFP remains highly immunogenic in mice with late (8 weeks old) versus early (4 weeks old/at birth) expression of GFP via doxycycline. P values shown are at 1:50 dilution by two-way ANOVA with Tukey post hoc analysis. All P values represent mean ± SEM.
Article Snippet: After 24 hours, cells were fixed with 10% formalin, washed with PBS, blocked/permeabilized in Animal-Free Blocker containing 0.3% Triton X-100, and incubated overnight with Rabbit anti-Luciferase (Abcam; ab185923, 1:500 dilution) or
Techniques: Animal Model, Expressing, Luciferase, Enzyme-linked Immunosorbent Assay, Control, Enzyme-linked Immunospot, Produced

Journal: Cancer Research Communications
Article Title: Overcoming Xenoantigen Immunity to Enable Cellular Tracking and Gene Regulation with Immune-competent “NoGlow” Mice
doi: 10.1158/2767-9764.CRC-24-0062
Figure Lengend Snippet: Mutant GFP and luciferase induce immune responses comparable with wild-type (WT) proteins. A, WT male Balb/c mice were vaccinated with Ad encoding WT or mutant copies of GFP (ΔT64; n = 5/group) and serum antibody responses were measured after 3 weeks. Mice showed equivalent anti-GFP responses whether vaccinated with WT or mutant GFP. B, WT female C57Bl/6 mice were vaccinated with Ad-GFP-Luc WT or Ad-Luc mutant (G315A; n = 5/group) and serum antibody responses were measured after 3 weeks revealing similar levels of anti-Luc antibodies. P values for A, B are at 1:50 dilution by two-way ANOVA with Tukey multiple comparisons test. C, Male WT Balb/c mice were vaccinated with Ad encoding WT or mutant GFP (ΔT64) or Luc (H245R) and anti-GFP or -Luc T-cell responses in the spleens were detected after 3 weeks via ELISpot. Both WT and mutant forms of GFP and Luc were able to elicit robust T-cell responses compared with mice naïve for the respective antigen. P values were determined by two-way ANOVA with Tukey post hoc analysis. D, E0771 GFP-Luc cells were implanted in MFPs of female WT C57Bl/6 mice and were vaccinated with Ad encoding WT GFP, mutant GFP (ΔT64), WT Luc, mutant Luc (ΔH245), or LacZ control ( n = 5 per group) after three days. Compared with LacZ control vaccination, GFP WT/mutant, or Luc WT/mutant vaccines resulted in a comparable reduction in tumor growth. P values are at time of euthanasia by two-way ANOVA with Tukey multiple comparisons test. All P values represent mean ± SEM.
Article Snippet: After 24 hours, cells were fixed with 10% formalin, washed with PBS, blocked/permeabilized in Animal-Free Blocker containing 0.3% Triton X-100, and incubated overnight with Rabbit anti-Luciferase (Abcam; ab185923, 1:500 dilution) or
Techniques: Mutagenesis, Luciferase, Enzyme-linked Immunospot, Control, Vaccines

Journal: Cancer Research Communications
Article Title: Overcoming Xenoantigen Immunity to Enable Cellular Tracking and Gene Regulation with Immune-competent “NoGlow” Mice
doi: 10.1158/2767-9764.CRC-24-0062
Figure Lengend Snippet: NoGlow mice express eGFP and Luciferase without background fluorescence and bioluminescence. A, Diagram of the NoGlow construct. LoxP-flanked stop site prevents expression of the NoGlow construct in the absence of Cre recombinase. However, in the presence of Cre the stop site is recombined to yield a single transcript encoding rtTA3 and mutant GFP/Luc driven by the CAG promoter. B, Chimeric founder NoGlow animals were crossed to CMV (full-body) Cre animals to test activity and expression of the construct. Representative bioluminescence imaging of female C57Bl/6, CAG Luc-GFP, and F1 CMV Cre NoGlow littermates with or without the NoGlow construct reveal no background bioluminescence in CMV Cre NoGlow+ animals. C, Bioluminescent imaging of representative lungs/livers shows no background bioluminescence in NoGlow+ mice. D, Chromogenic Luciferase staining in livers from NoGlow+ and control mice confirms luciferase protein expression despite the lack of bioluminescence in B and C. E, Representative fluorescent imaging of male C57Bl/6, CAG Luc-GFP, and F1 CMV Cre NoGlow animals shows no background fluorescence in CMV Cre NoGlow+ mice, while immunofluorescent staining ( F ) for GFP in liver sections from CMV Cre NoGlow+ animals confirms that GFP protein can be detected upon antibody staining.
Article Snippet: After 24 hours, cells were fixed with 10% formalin, washed with PBS, blocked/permeabilized in Animal-Free Blocker containing 0.3% Triton X-100, and incubated overnight with Rabbit anti-Luciferase (Abcam; ab185923, 1:500 dilution) or
Techniques: Luciferase, Fluorescence, Construct, Expressing, Mutagenesis, Activity Assay, Imaging, Staining, Control

Journal: Cancer Research Communications
Article Title: Overcoming Xenoantigen Immunity to Enable Cellular Tracking and Gene Regulation with Immune-competent “NoGlow” Mice
doi: 10.1158/2767-9764.CRC-24-0062
Figure Lengend Snippet: NoGlow mice reveal the impact of sex and tissue distribution on immune tolerance. A, Male WT ( n = 3), CAG Luc-GFP ( n = 3), and NoGlow+ ( n = 6) or NoGlow− ( n = 10) littermates were vaccinated with an Ad encoding WT GFP-Luc and serum was collected after two weeks for anti-Luc or anti-GFP responses. Unvaccinated naïve WT ( n = 2) animals were used as baseline controls. B, Luc staining showing protein expression in mammary epithelium of female MMTV Cre NoGlow+ or NoGlow− littermates. C, Luc staining showing protein expression in prostate epithelium of male Pbsn Cre NoGlow+ or NoGlow− littermates. D, Luc staining demonstrating expression in acini and islets in pancreases of male Pdx1 Cre NoGlow+ or NoGlow− littermates. E–G, MMTV Cre (E; n = 4 NoGlow- F, n = 5 NoGlow+ F, n = 2 NoGlow- M, n = 7 NoGlow+ M, n = 3 naïve), Pbsn Cre (F; n = 6 NoGlow- F, n = 6 NoGlow+ F, n = 4 NoGlow- M, n = 8 NoGlow+ M, n = 1 naïve), or Pdx1 Cre (G; n = 2 NoGlow- F, n = 4 NoGlow+ F, n = 4 NoGlow- M, n = 5 NoGlow+ M, n = 2 naïve) littermates were vaccinated with an Ad encoding WT eGFP and Luc. Serum antibody responses to Luc and GFP were determined by ELISA two weeks postvaccination. P values for A, E, F, G are displayed at 1:50 and determined by two-way ANOVA with Tukey correction. H, Normalized ratio of serum anti-Luc or -GFP antibody responses in independent NoGlow+ versus mean of NoGlow− littermates across two independent experiments demonstrating highest tolerance in CMV Cre and Pdx1 Cre animals. P values were determined by one-way ANOVA with Tukey correction. All P values represent mean ± SEM.
Article Snippet: After 24 hours, cells were fixed with 10% formalin, washed with PBS, blocked/permeabilized in Animal-Free Blocker containing 0.3% Triton X-100, and incubated overnight with Rabbit anti-Luciferase (Abcam; ab185923, 1:500 dilution) or
Techniques: Staining, Expressing, Enzyme-linked Immunosorbent Assay

Journal: Cancer Research Communications
Article Title: Overcoming Xenoantigen Immunity to Enable Cellular Tracking and Gene Regulation with Immune-competent “NoGlow” Mice
doi: 10.1158/2767-9764.CRC-24-0062
Figure Lengend Snippet: Tumor cells expressing GFP, rtTA, and Luciferase successfully engraft in NoGlow mice. A, Diagram of triple-transgenic (3 ×) E0771 cells. GFP and rtTA are constitutively expressed and Luc is induced with the addition of doxycycline. B, 3 × E0771 (10 6 ) were implanted into the mammary fat pad (MFP) of wild-type (WT) C57Bl/6 ( n = 7), CAG-driven Full-body WT GFP/Luc expressing mice ( n = 7), CMV cre littermates positive ( n = 6) or negative ( n = 7) for the NoGlow construct, or SCID beige ( n = 4) mice. C, Overall (top) and individual (bottom) tumor growth in each group. No evidence of tumors was observed in Full-body GFP-Luc, NoGlow−, or C57Bl/6 animals by the end of experiment. D, Representative bioluminescence imaging of animals pre (left) or post (right) doxycycline diet introduction. Bottom, Luc was induced in SCID mice but to a lesser degree compared with NoGlow+ mice. E, Representative GFP imaging upon euthanasia of Noglow+, SCID, and Full-body GFP-Luc mice. Left, concentrated GFP signal in tumors of NoGlow+ and SCID compared with Full-body GFP-Luc mice. Right, visceral GFP signal only in Full-body GFP-Luc mice. F, Representative lungs of NoGlow+, NoGlow−, Full-body GFP-Luc, or SCID mice upon euthanasia. Lung metastasis can be visualized in NoGlow+ and SCID animals.
Article Snippet: After 24 hours, cells were fixed with 10% formalin, washed with PBS, blocked/permeabilized in Animal-Free Blocker containing 0.3% Triton X-100, and incubated overnight with Rabbit anti-Luciferase (Abcam; ab185923, 1:500 dilution) or
Techniques: Expressing, Luciferase, Transgenic Assay, Construct, Imaging

Journal: Cancer Research Communications
Article Title: Overcoming Xenoantigen Immunity to Enable Cellular Tracking and Gene Regulation with Immune-competent “NoGlow” Mice
doi: 10.1158/2767-9764.CRC-24-0062
Figure Lengend Snippet: Summary of tumor behavior in differentially tolerant animal models. A, Xenoantigen-bearing tumor cells implanted orthotopically into immune-deficient mice typically grow and metastasize as expected and can be easily observed with fluorescence/bioluminescence. B, Conversely, in immune-competent animals the presence of foreign immunogens often results in complete rejection of the primary tumor, or severely restricts expression of immunogenic antigens and limits the utility of reporter proteins. C, However, NoGlow mice are tolerant to foreign GFP, Luciferase, and rtTA, thus allowing primary tumor growth and de novo metastasis of xenoantigen-expressing tumor cells.
Article Snippet: After 24 hours, cells were fixed with 10% formalin, washed with PBS, blocked/permeabilized in Animal-Free Blocker containing 0.3% Triton X-100, and incubated overnight with Rabbit anti-Luciferase (Abcam; ab185923, 1:500 dilution) or
Techniques: Fluorescence, Expressing, Luciferase